by Jin Wu
In 2013, the federal government spent about $65 billion on prescription drugs covered by Medicare’s Part D program; and more than half of them were for branded drugs, according to the Centers for Medicare and Medicaid Services.
The addition of prescription-drug coverage, started in 2006, was Medicare’s largest expansion since its creation in 1965. Medicare Part D provides affordable prescription drugs to more than 39 million seniors and the disabled.
Total Drug Cost Per Person

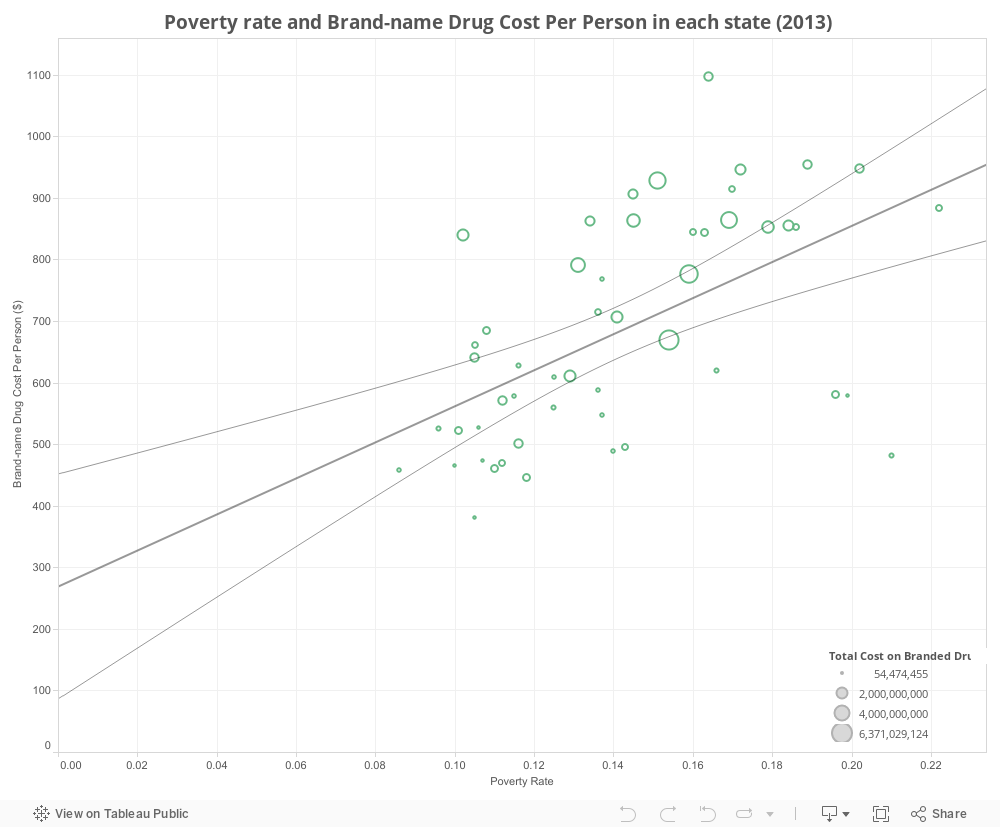
Many states with higher poverty rates used slightly more prescription drugs, according to an analysis of data published by Center of Medicare and Medicaid in early 2014 and the Census statistics.
“Certainly, [states with higher poverty] may have higher levels of diabetes, higher levels of hypertension,” said Jack Hoadley, research professor in the Health Policy Institute at Georgetown University. These diseases would potentially lead to higher usage of prescription drugs.
Diving deeper, those states sometimes also have higher brand-name drug usage. Louisiana, with the second highest poverty rate in U.S., also has the second highest usage of brand-name drugs. Kentucky, which ranks fifth highest on poverty rate, spent $954 on brand-name drug per person, which is only less than what Alabama spent.
Other states such as Alabama, Georgia, West Virginia, Mississippi and Texas, part of ten states that spent most on branded drug per person, also have a quite high brand-name drug usage while the poverty rate there is high.
For instance, Mississippi, with a poverty of more than 22 percent, spent almost $900 on brand-name drugs per person. Alabama, which spent most on branded drug per person in the Unites States, has a poverty rate of 16 percent.
Hoadley speculates that there could be a potential connection between poverty rate and brand-name drug usage. “Although people with low-income may have more incentives to use generic drugs due to price issues, they may be less knowledgeable about if generics are equally good as branded one,” he said during a phone interview. “They may be more suspicious.”
In 2014, CMS first published the detailed data of prescription drug cost in 2013. The database tracked 3,450 different drugs prescribed by a million doctors, nurse practitioners, medical students, dentists and other providers.
Federal officials said they hoped that making the data transparent would lead to new studies about the prescribing patterns of doctors and for particular drugs.
“Having a better sense on the side of Part D drugs and increase publicity of which doctors are using a specific drug opened more policy discussion,” Hoadley said.
The heated debate on cost of brand-name drugs reached its peak when drugs curing hepatitis C went to the market. In 2013, Part D spent about $286 million on earlier-generation hepatitis C drugs; the number increased to $4.5 billion in 2014 after new hepatitis C drugs were commercialized.
Why do these specialty drugs cost so much? Gilead, the company manufacturing Hepatitis C drug Sovaldi, claims that the pricing reflects its value.
“In the years in the past, it was typical for manufacturers to justify their prices based on the cost of making the drug as well as researching the drug,” Hoadley said. “Companies did a lot of unsuccessful attempts to develop a new drug, and only a relatively small percentage of the drugs they’ve tried to develop end up being approved to the market. But today, companies are justifying their prices in terms of money saved for the system or the value of those drugs to the patients who are taking them. This is questionable.”
According to the CMS, specialties of internal medicine, family practice, nurse practitioner, neurology and psychiatry has prescribed drugs with highest total cost in 2013. These five specialties are also the ones that prescribed the most brand-name drugs.
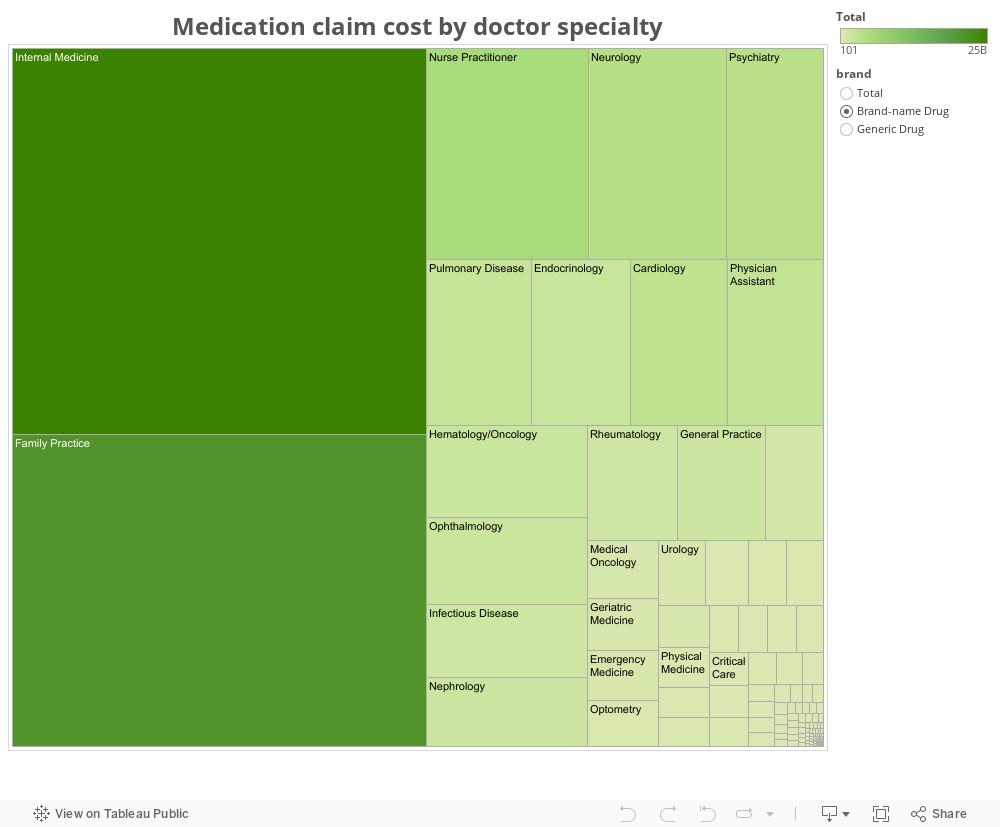
While generic drugs are more and more often prescribed to patients due to their more reasonable prices, some specialties still prescribed more brand-name drugs than generics in 2013: cardiology, critical care, health maintenance organization, ophthalmology, optometry, pediatric and pulmonary disease.
For instance, optometry doctors had more than 2 million claims prescribing branded drugs and just under 1.5 million claims prescribing generic drugs. Cost per branded drug prescription is almost 10 times of what a generic drug prescription cost. Pediatrics had 179 claims for generic drugs while the one for branded drugs were 225, and the cost for the latter is more than 14 times of what generic drugs cost.
Price gap among different pharmacies could also be one of the reasons leading to the high cost of drug prescription. Doc&i is an online platform for doctors and patients to check prices of prescription drugs in different pharmacy stores. Co-founder Brad Becker said that the price gap sometimes is quite big. With more transparency on drug pricing, patients as well as doctors could save much money and time. Disclosed data could also provide patients with questions about drugs prescribed to them.
Some industry experts called for caution in examining the CMS data in April. PhRMA, a drug industry trade group, said in a statement that “significant price negotiation exists in Part D and results in rebates of as high as 20 to 30 percent for branded medicines; and these savings are not reflected in the data.”
The American Medical Association also said the data could be misleading. “The data does not account for varying strengths or dosage levels of the medications or varying patient needs,” it said in a written statement.
The Congressional Budget Office estimates that Part D spending will total $76 billion in 2015, up $11 billion from 2013, representing 14 percent of total Medicare spending in 2015.